When signing in to Grafana via OAuth the dashboard will default to the "Viewer" role if a specific role can not be matched. Roles need to be supplied to the OAuth UserInfo endpoint to support logging in as an Admin or Editor.
See the Generic OAuth authentication documentation for useful information.
- Matching Keycloak Roles with Grafana
- Set Up the Keycloak Roles
- Testing the UserInfo Endpoint in Keycloak
Matching Keycloak Roles with Grafana
Set the role_attribute_path property to match roles.admin and roles.editor. If the OAuth response contains neither role the attribute will fall back to the viewer role (matching the default Grafana behaviour):
# /etc/grafana/grafana.ini
[auth.generic_oauth]
role_attribute_path = contains(roles[*], 'admin') && 'Admin' || contains(roles[*], 'editor') && 'Editor' || 'Viewer'
Set Up the Keycloak Roles
In the Keycloak admin area create 2 new roles under Configure > Roles named admin and editor.
Under Configure > Clients select the client and go to the Mappers tab. Create a new protocol mapper with the following settings:
- Name: roles
- Mapper Type: User Realm Role
- Multivalued: on
- Token Claim Name: roles
- Claim JSON Type: String
- Add to ID token: on
- Add to access token: on
- Add to userinfo: on
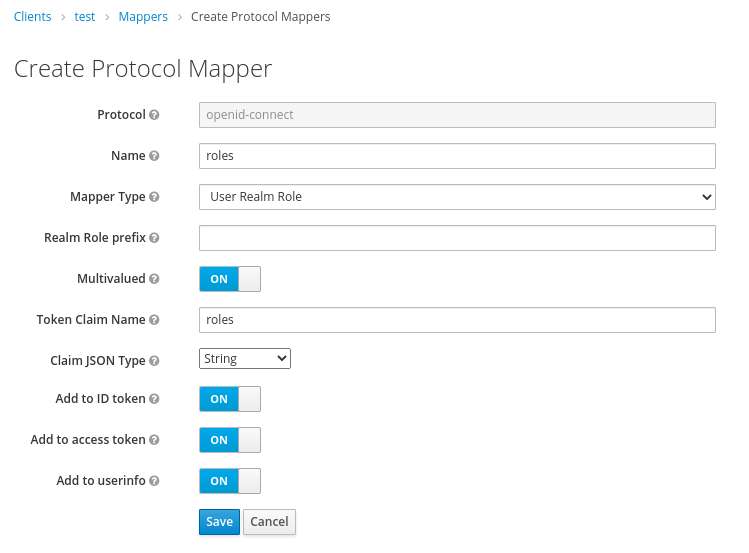
After creating this mapper the roles data should now be added to the UserInfo endpoint.
Finally, under Manage > Users, select a user, go to the Role Mappings tab and assign one of the newly added roles. Sign in to Grafana with the selected user, they should now have the relevant role assigned.
Testing the UserInfo Endpoint in Keycloak
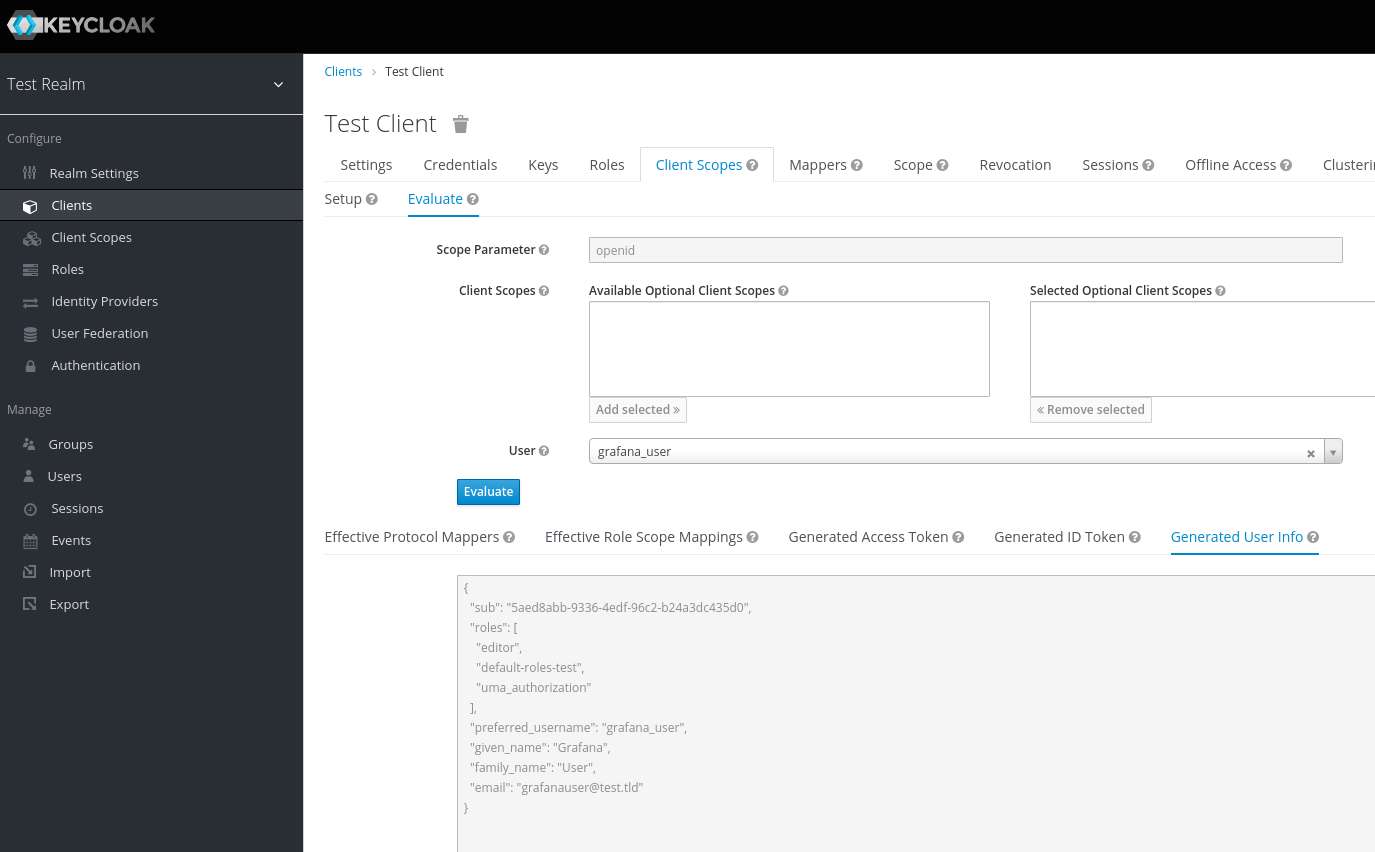
The Keycloak admin area provides an interface for evaluating the users data returned on from the UserInfo endpoint. This can be used to check that roles are being sent to Grafana as intended.
Under Configure > Clients:
- Select the client and go to the Client Scopes tab
- Select the nested Evaluate tab
- Go to the Select a user... dropdown, enter a user and click Evaluate
- Select the Generated User Info tab
Setting the Grafana log level to debug can also be used to log information returned from OAuth requests.
# /etc/grafana/grafana.ini
[log.file]
level = debug